Getting Started #
After you download a report, you can use the Edit Query button on the ribbon to modify the structure.
Most TAD Reports are built using SQL Statements, which generate the same output as the corresponding Vista reports. However, you don’t need to write SQL statements to create or modify a report. Instead, you simply select the columns you need from the Available Columns list, which is based on the SQL tables already included in the report. This structured approach ensures that you can easily customize reports without needing a deep understanding of SQL.
Each report follows a standard format, consisting of different SQL components: SELECT, FROM, JOIN, WHERE, and GROUP BY. These parts determine how data is retrieved, filtered, and displayed in Excel.
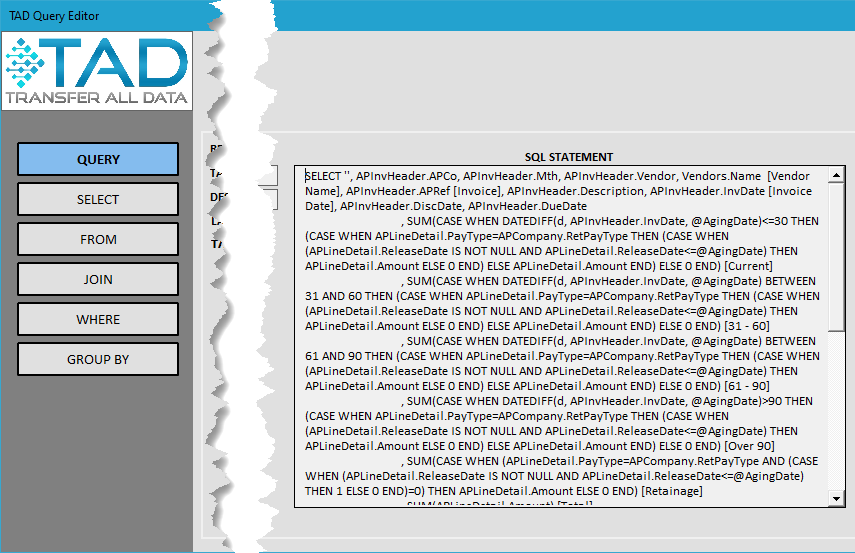
The image below shows the SQL Statement for the AP Aging report.
SQL Parts Overview
| SQL Part | Description |
|---|---|
| SELECT | Specifies which columns (fields) should be included in the report output. |
| FROM | Defines the main table where the data comes from. |
| JOIN | Connects additional tables to bring in extra columns for display or filtering. |
| WHERE | Filters the data based on specific conditions, either fixed values or user-selected parameters. |
| GROUP BY | Organizes data into groups, setting the sort order and defining how records are grouped when applying formatting. |
Explanation of SQL Parts
- SELECT – Determines which columns will be included in the report download. For example, you might choose fields like Invoice Number, Amount, and Date.
- FROM – Identifies the main table that holds the core data for the report. Each report has a primary data source that drives the results.
- JOIN – Combines other related tables to pull in extra details. This is useful when you need additional fields that aren’t available in the main table.
- WHERE – Filters data to show only the relevant records. You can use fixed values or allow user-defined parameters to refine results.
- GROUP BY – Defines how the records are grouped and sorted. This also impacts the formatting if grouping is applied in the report design layout.
By understanding these SQL parts, users can better interpret how TAD Reports structure and organize data, ensuring the most relevant and formatted results.
Edit the Report #
The topics below walk you through modifying different sections of a report, allowing you to customize its structure and data retrieval.
Core 4
These fundamental topics cover the most common changes made to report structures:
- Change Column Layout – Modify which columns are included in the report.
- Join Additional Tables – Retrieve additional data by linking related reports.
- Filter Data and Create Parameters – Apply filters and create dynamic parameters to refine the report’s results.
- Add Sort Order to Download – Control the order in which records appear in the report.
Advanced Topics
For users who need more complex modifications, these topics provide deeper insights into SQL Statement structures:
- Understanding Select Functions – Learn how different SQL functions impact data selection.
- Using Select Functions – Apply functions to manipulate data within the Select statement.
- Understanding SQL Joins – Get an overview of how joins work and their different types.
- Add Advanced Joins – Implement more complex joins to retrieve data from multiple tables efficiently.
- Using the Report Design Layout – Customize reports by selecting columns, adjusting filters, and defining the format to ensure clean and organized data presentation.
These topics provide the foundation for customizing report structures while maintaining compatibility with TAD’s data extraction, filtering, and formatting actions.