Getting Started #
Transfer All Data (TAD) provides predefined layouts for essential financial reports, including the Balance Sheet, Income Statement, Cash Flow, and Trial Balance. These layouts replicate standard financial statement structures and can be customized before importing them into Vista, ensuring flexibility and compatibility with existing data.
Key Features
- Centralized Setups
- Financial statement configurations are stored in the Vista User Database module, providing a single location for setup and maintenance.
- Drilldown Capability
- Users can drill down into any balance to view detailed General Ledger (GL) transactions and related attachments from source modules.
- Setup Validation
- A unique validation report identifies missing GL accounts, ensuring all accounts are referenced in financial statements.
- Company & Departmental Reporting
- Layouts can be designed with each company or department as individual columns, or values can be entered during the data download process.
These features streamline financial reporting, enhance data accuracy, and improve visibility into financial performance within Vista.
Financial Statement Structure #
Each financial statement consists of two key components.
- Row Definition – A structured set of Financial Rows that defines what appears on each row, including:
- Row Type: Can be a Title, Summary, Formula, Detail, and more.
- Summary Rows: Can reference individual GL accounts or account ranges, with multiple accounts/ranges separated by commas.
- GL Account Reference: Typically references Part1 of the GL account, but full GL account strings can also be used when necessary.
- Column Definition – A structured set of Financial Columns that determines how financial data is displayed, such as:
- Period Comparisons (e.g., Current vs. Prior Year)
- Department/Company Breakdowns (each department or company as a separate column)
- Budget vs. Actual Comparisons
By defining both Rows and Columns, users can generate highly flexible and detailed financial statements tailored to their reporting needs.
Financial Rows #
Financial rows define the structure and content of each row in a financial statement. Each row type serves a specific purpose, from displaying headers to summarizing GL balances. By combining different row types, users can create customized financial reports that meet their specific needs.
Types of Financial Rows
Only the following row types can directly reference GL accounts: Summary, Detail, and DetailGroup. These rows allow for summing, grouping, or individually displaying GL account balances.
- Detail
- Generates a row for each GL Account included in the configuration.
- Example: If configured for accounts 4000 – 4099, a separate row will be created for each GL account within that range, displaying the corresponding balance.
- DetailGroup
- A hybrid between Summary and Detail rows.
- Initially displays a single summary balance but allows users to expand/collapse to view detailed GL account-level data.
- Example: A row labeled Operating Expenses may start as a single row but can expand to show detailed accounts like Rent, Utilities, and Payroll.
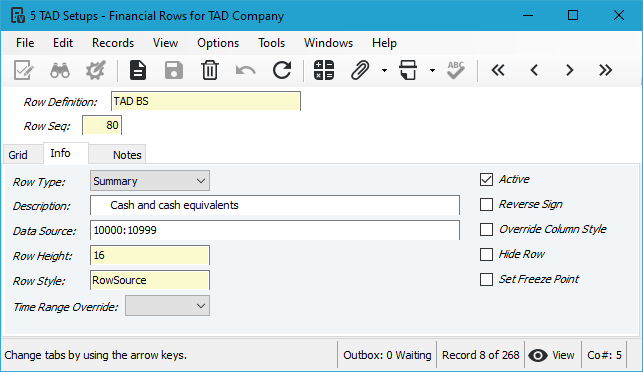
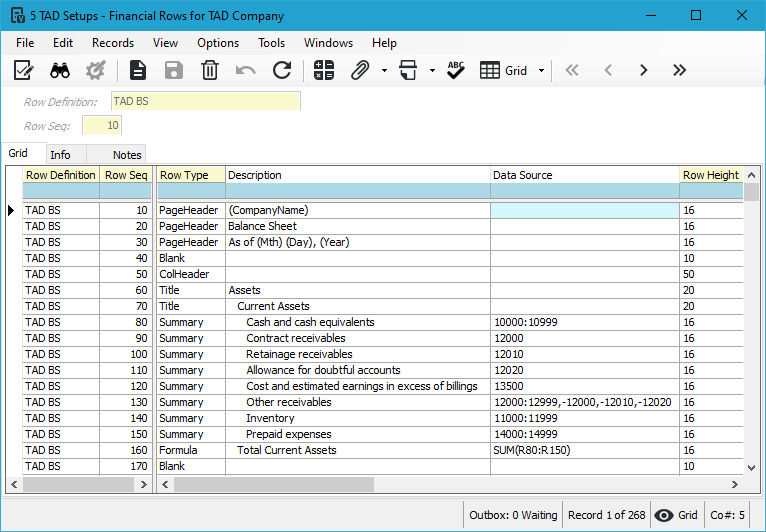
- Summary
- Produces a single row with the summed balance of all referenced GL accounts.
- Multiple accounts or account ranges can be referenced using comma-separated values.
- Example: A Total Revenue row could sum accounts 4000 – 4099.
The other rows types are listed below.
- Blank
- Inserts an empty row, with spacing adjustable using the Row Height column.
- ColHeader
- Displays column headers based on the Financial Column definitions.
- Example: If a column represents Year-to-Date (YTD) values for January 2025, this row would display “January 2025 YTD.”
- Formula
- Contains an Excel formula to perform calculations within the report.
- Commonly used to summarize other rows but supports any valid Excel formula.
- PageHeader
- Displays report metadata such as Company Name, Report Type, and Reporting Period.
- Uses special variables to dynamically adjust based on report parameters.
- Title
- Displays text entered in the Description field, often used for section headings or report labels.
Financial Columns #
Financial columns define the structure and content of each column in a financial report. Each column type serves a specific purpose, from displaying GL balances to providing calculated values. By combining different column types, users can create customized financial reports that effectively present financial data.
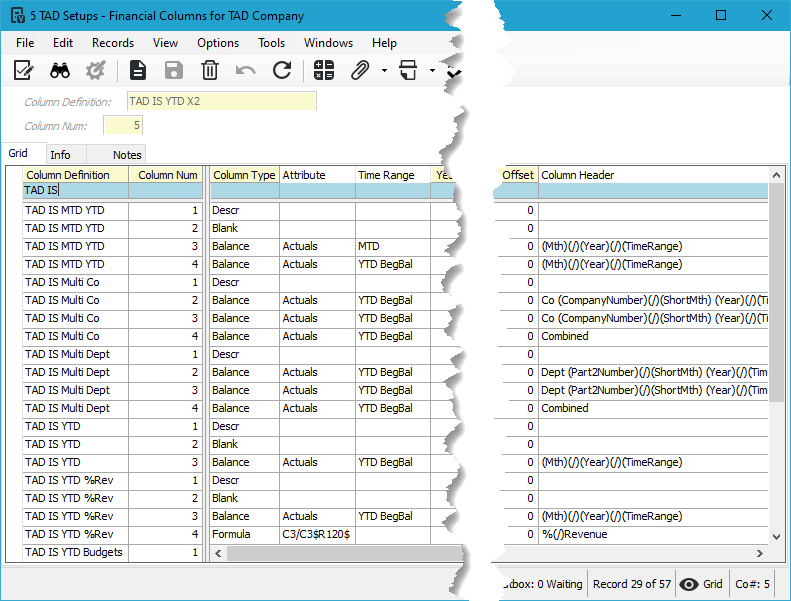
Types of Financial Columns
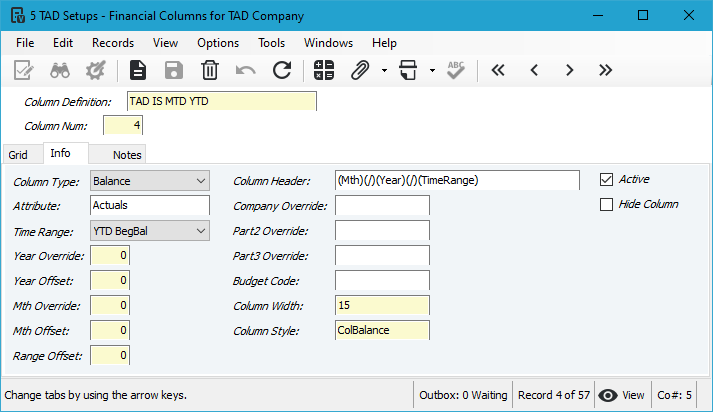
- Balance
- Displays balances for Summary, Detail, DetailGroup, and Formula row types.
- Example: A column labeled “Current Month Actual” could show the GL balance for each row’s referenced accounts.
- Blank
- Creates an empty column that can be resized using the Column Width field.
- Commonly used for spacing or formatting in the report.
- Descr
- Displays the Financial Row Description value for the specific row.
- Example: If a row represents “Total Operating Expenses”, this column would display that text.
- Formula
- Generates values based on an Excel formula applied to the column setup.
- Used to calculate differences between Balance columns or perform calculations like each row’s percentage of total revenue.
- Example: A column labeled “% of Revenue” could contain a formula dividing each row’s balance by total revenue.
Time Ranges for Balance Columns
Time ranges define the financial period represented by each Balance column. These ranges allow users to display data for specific reporting periods, from monthly activity to lifetime-to-date balances.
- BegBal
- Displays the beginning balance for the fiscal period.
- MTD
- Displays financial activity for the current month.
- QTD
- Displays financial activity for the past three months ending in the column’s period.
- Unlike standard calendar quarters (Jan-Mar, Apr-Jun, etc.), QTD always reflects a rolling three-month period based on the selected report month.
- Example
- If the report is run for December 2024, QTD will include October 2024 – December 2024.
- If a Month Offset of -2 is applied, QTD will shift back two months, covering August 2024 – October 2024 instead.
- YTD
- Displays the financial activity for the entire year.
- Commonly used in Cash Flow reports.
- YTD BegBal
- Displays the year-to-date activity, including the beginning balance.
- This is the most common time range used in financial reports.
- LTD
- Displays financial activity from the inception of the account up to the current period.
- Range
- Defines a custom rolling period ending in the column’s assigned period.
- Used in combination with the Range Offset field to display totals over a set number of months.
- Example
- If the report is run for December 2024 with a Range Offset of -5, the column will display totals for August 2024 – December 2024 (a rolling 5-month total).
- Functions similarly to QTD, but with a configurable number of months instead of a fixed 3-month period.
Balance Column Attributes
Balance columns are assigned an Attribute that defines the type of financial data retrieved for each row. These attributes determine whether the column pulls actual transactions, budgeted amounts, or only specific debit or credit balances.
By assigning the appropriate Balance Column Attribute, users can customize financial reports to compare actual vs. budgeted amounts or analyze debit and credit activity separately.
- Actuals
- Retrieves actual GL balances based on posted transactions.
- Debits
- Retrieves the net debit balance for the row.
- Credits
- Retrieves the net credit balance for the row.
- Budgets
- Retrieves GL budget amounts stored in Vista’s GL Budgets module.
Parameters #
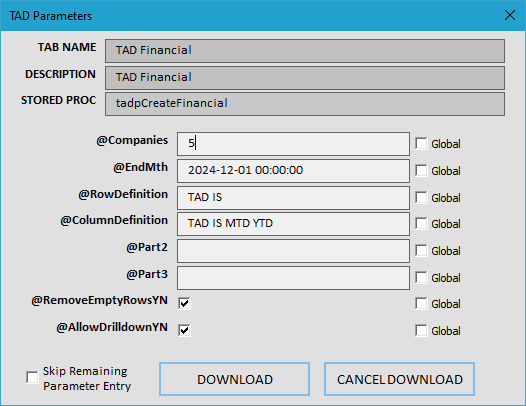
All Financial Statement reports use the same base TAD Financial report, accessible via the Reports button on the ribbon.
- You can select one or more companies to generate a consolidated financial statement.
- The default end month determines the reporting period, but each column’s configuration can adjust this period using Month/Year Offsets and Overrides to display different time ranges.
- A Row Definition and Column Definition must always be selected—this combination structures the final Financial Statement output.
- Remove Empty Rows: Automatically removes any row where all Balance columns contain a $0 value, streamlining the report output.
- Allow Drilldown: Adds drilldown capability to each Balance column, allowing users to click on any balance to view GL detail and related attachments for deeper analysis.