Getting Started #
Extracting data from Vista into Excel can be frustrating. While Vista’s built-in reports are Crystal Reports files that can be customized, doing so requires knowledge of Crystal Reports Writer, which many users don’t have. SQL Server Management Studio provides another way to access data, but it requires a deep understanding of database tables and SQL queries—making it inaccessible for most users.
Even if you manage to export a report from Vista, the formatting is often messy, requiring time-consuming cleanup before the data is usable. If you need updated information, you must repeat the entire process. Additionally, standard reports may not include all the fields or filtering options necessary to get the exact data you need.
Another common challenge is working across multiple companies. Vista requires running separate reports for each company, whereas TAD Reports streamline this process by allowing you to select multiple companies and generate a consolidated report in one step.
TAD Reports simplify data extraction by providing clean, formatted data directly in Excel—saving you time and effort while ensuring you get exactly what you need.
Report Structure #
Most TAD Reports are built using SQL Statements, which generate the same output as the corresponding Vista reports. However, you don’t need to write SQL statements to create or modify a report. Instead, you simply select the columns you need from the Available Columns list, which is based on the SQL tables already included in the report. This structured approach ensures that you can easily customize reports without needing a deep understanding of SQL.
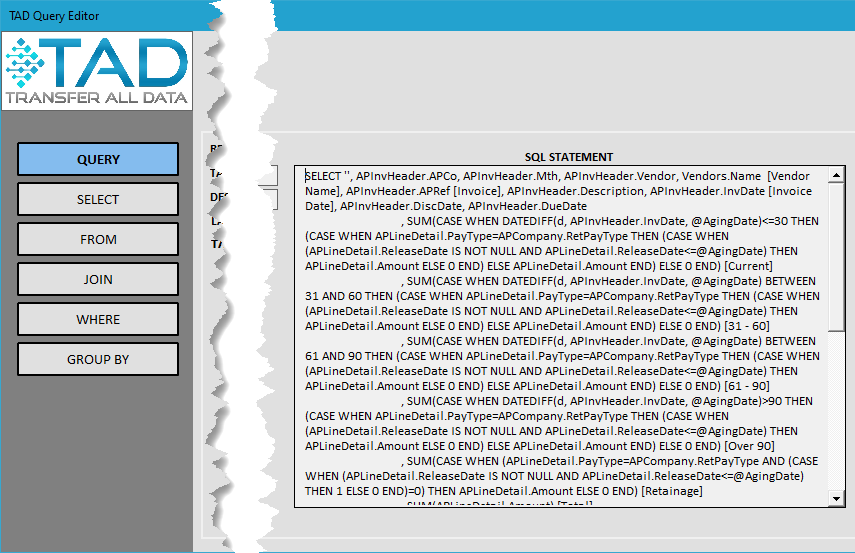
Each report follows a standard format, consisting of different SQL components: SELECT, FROM, JOIN, WHERE, and GROUP BY. These parts determine how data is retrieved, filtered, and displayed in Excel.
SQL Parts Overview
| SQL Part | Description |
|---|---|
| SELECT | Specifies which columns (fields) should be included in the report output. |
| FROM | Defines the main table where the data comes from. |
| JOIN | Connects additional tables to bring in extra columns for display or filtering. |
| WHERE | Filters the data based on specific conditions, either fixed values or user-selected parameters. |
| GROUP BY | Organizes data into groups, setting the sort order and defining how records are grouped when applying formatting. |
Explanation of SQL Parts
- SELECT – Determines which columns will be included in the report download. For example, you might choose fields like Invoice Number, Amount, and Date.
- FROM – Identifies the main table that holds the core data for the report. Each report has a primary data source that drives the results.
- JOIN – Combines other related tables to pull in extra details. This is useful when you need additional fields that aren’t available in the main table.
- WHERE – Filters data to show only the relevant records. You can use fixed values or allow user-defined parameters to refine results.
- GROUP BY – Defines how the records are grouped and sorted. This also impacts the formatting if grouping is applied in the report design layout.
By understanding these SQL parts, users can better interpret how TAD Reports structure and organize data, ensuring the most relevant and formatted results.
Ribbon Buttons #
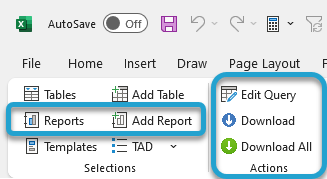
The primary ribbon buttons you’ll use for working with Reports are listed below.
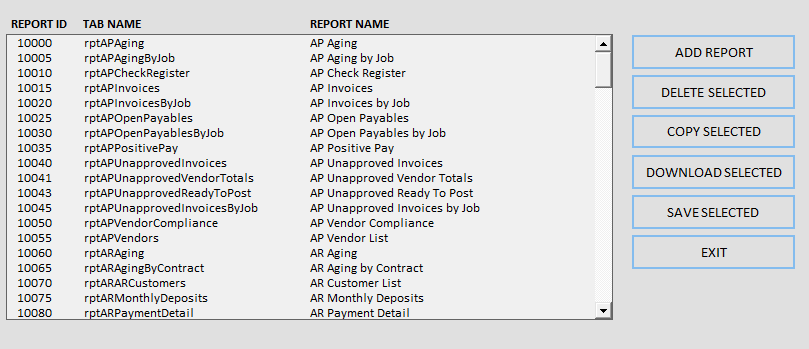
- Reports – Download one of the standard reports.
- Download one of the Company Reports that you can upload to your Vista configuration.
- Add Report – Download a single report built from scratch.
- Edit Query – Use to edit the structure (columns, joins, conditions) of the Table/Report.
- Download – Downloads the selected worksheet.
- Download All – Downloads all worksheets in the workbook.
Parameters #
When downloading most tables, you’ll find a parameter that allows you to filter data by Company or Group.
- Press F4 or double-click the parameter field to open the TAD Lookup form.
- Parameters enclosed in parentheses ( ) can accept multiple values, depending on the Companies available in your environment.
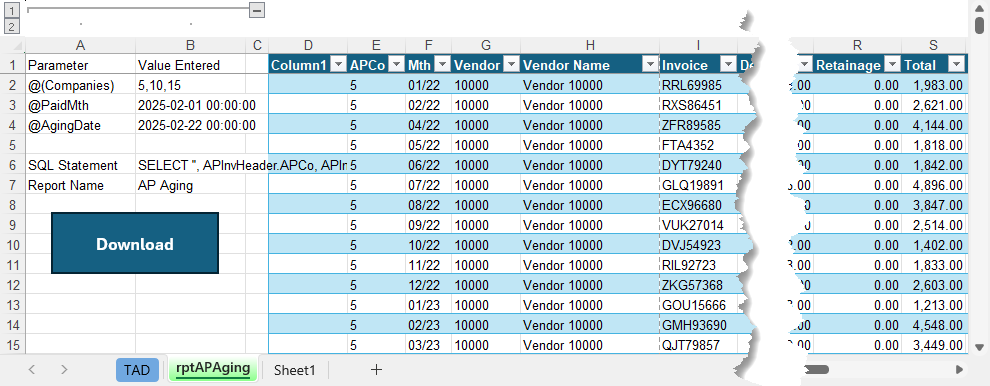
For example, the AP Aging report includes a parameter for the AP Companies.
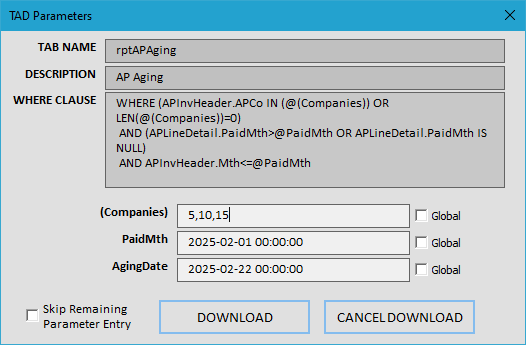
When you download data, the parameter values will be stored in columns A and B.